Introduction
The term PM2.5 refers to fine particles or droplets of size 2.5 microns are less. This is 30 times smaller than an human hair. These particles are so small that they can directly reach your blood stream through the lungs.
There is no safe level for PM2.5!
You can track PM2.5 for Whitefield, Bangalore at https://aircare.mapshalli.org

Where does PM2.5 come from?
These particles come from vehicle exhausts, vehicle brakes, construction, road dust, fuel burning, and industrial operations. PM is a mixture with physical and chemical characteristics varying by location. Common chemical constituents of PM include sulfates, nitrates, ammonium, other inorganic ions such as ions of sodium, potassium, calcium, magnesium and chloride, organic and elemental carbon, crustal material, particle-bound water, metals (including cadmium, copper, nickel, vanadium and zinc) and polycyclic aromatic hydrocarbons (PAH). In addition, biological components such as allergens and microbial compounds are found in PM.
PM2.5 can remain in the atmosphere for days or weeks and thus can transported to long distances by air. PM2.5 apart from causing health issues also contributes to decreased visibility, depletion of soil nutrients, acid rains, and material damages to structures.
How is PM2.5 measured and what is the impact to health?
Long term exposure to these particles cause increase rates of heart disease, stroke, chronic bronchitis, reduced lung function, lung cancer, kidney disease, and diabetes.
PM2.5 is measured in µg/m3 (micro grams in a cubic meter). WHO recommended guidelines is 10 µg/m3 for annual average and this number is used as reference in all the studies to show the health impact of PM2.5. There is no safe level of PM2.5!
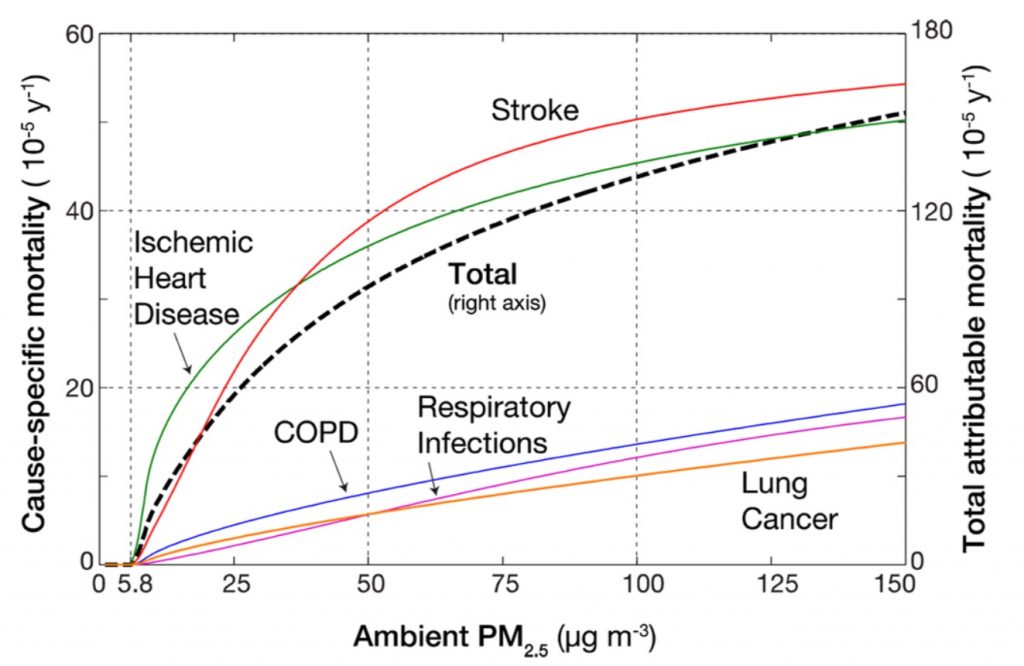
Source [6]
The above chart shows that adult heart disease and stroke account for ∼70% of combined PM2.5-attributable deaths. As an example, with ambient PM2.5 value of 50 µg/m3, in one year, 40 people would have died due to stroke (red line) in a population of 100,000.
A study found that for every increase in pollution of 10 µg/m3, there was a 25 to 37% increase in the number of veterans with new kidney disease, a 36% increase in rapid loss of kidney function, and a 31% increase in risk of kidney failure followed by dialysis.
What is the equivalent of number cigarettes smoked?
A PM2.5 level of 10 μg/m3 is equivalent to smoking half a cigarette per day [Source 4]. Unlike cigarette smoking, the pollution reaches every age group.
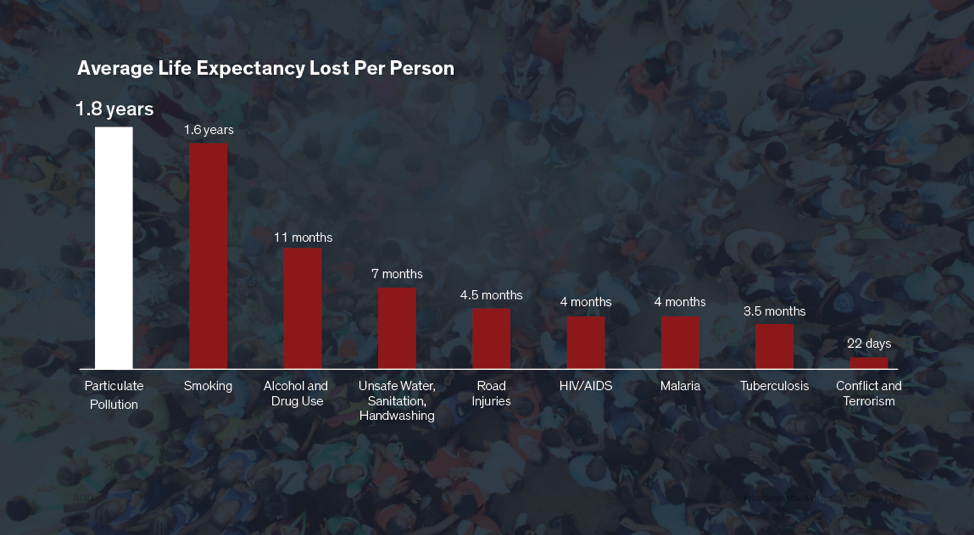
What is the loss in life expectancy due to particulate pollution
Sustained exposure to an additional 10 μg/m3 of PM2.5 reduces life expectancy by 0.98 years . This is called the potential years of life lost (PYLL) in the AirCare app. This is derived from The Air Quality Life Index (AQLI), that converts air pollution concentrations into their impact on life expectancy [Source 5].
PM2.5 Standards
WHO PM2.5 standards
WHO recommended guidelines is 10µg/m3 and there is no safe level of PM2.5.
USA PM2.5 standards
The USA standard for PM2.5 (µg/m3 24 hours), category, and health impacts are shown below.
- 0 to 12.0 – Good
- Air quality is considered satisfactory, and air pollution poses little or no risk.
- 12.1 to 35.4 – Moderate
- Air quality is acceptable; however, for some pollutants there may be a moderate health concern for a very small number of people who are unusually sensitive to air pollution.
- 35.5 to 55.4 – Unhealthy for Sensitive People
- Members of sensitive groups may experience health effects. The general public is not likely to be affected.
- 55.5 to 150.4 – Unhealthy
- Everyone may begin to experience some adverse health effects, and members of the sensitive groups may experience more serious effects.
- 150.5 to 250.4 – Very Unhealthy
- Health alert: everyone may experience more serious health effects.
- 250.5 to 500.4 – Hazardous
- Health warnings of emergency conditions. The entire population is more likely to be affected.
India PM2.5 standards
The Indian standard for PM2.5 (µg/m3 24 hours), category, and health impacts are shown below.
- 0 to 30 – Good
- Minimal impact
- 31 to 60 – Satisfactory
- May cause minor breathing discomfort to sensitive people.
- 61 to 90 – Moderately Polluted
- May cause breathing discomfort to people with lung disease such as asthma, and discomfort to people with heart disease, children and older adults.
- 91 to 120- Poor
- May cause breathing discomfort to people on prolonged exposure, and discomfort to people with heart disease.
- 121 to 250 – Very Poor
- May cause respiratory illness to the people on prolonged exposure. Effect may be more pronounced in people with lung and heart diseases.
- 250+ – Severe
- May cause respiratory impact even on healthy people, and serious health impacts on people with lung/heart disease. The health impacts may be experienced even during light physical activity.
US, India, and WHO air quality standards comparison (for up to 250 µg/m3)

Air Quality Index Comparisons – US and India
An air quality index (AQI) is used by government agencies to communicate to the public how polluted the air currently is or how polluted it is forecast to become. Public health risks increase as the AQI rises. Different countries have their own air quality indices, corresponding to different national air quality standards.
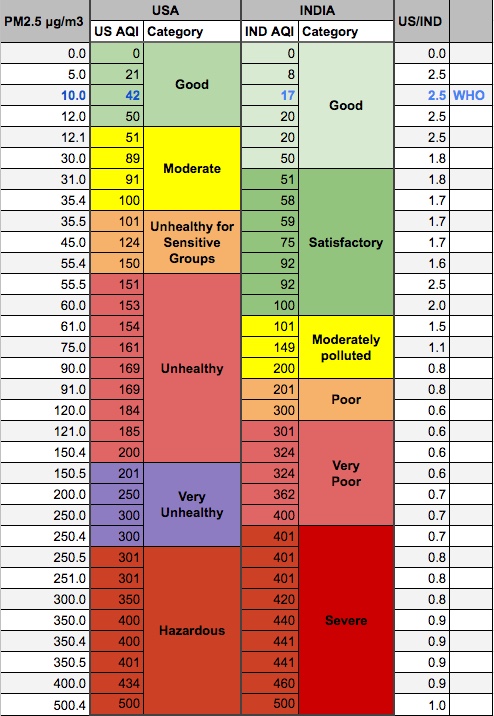
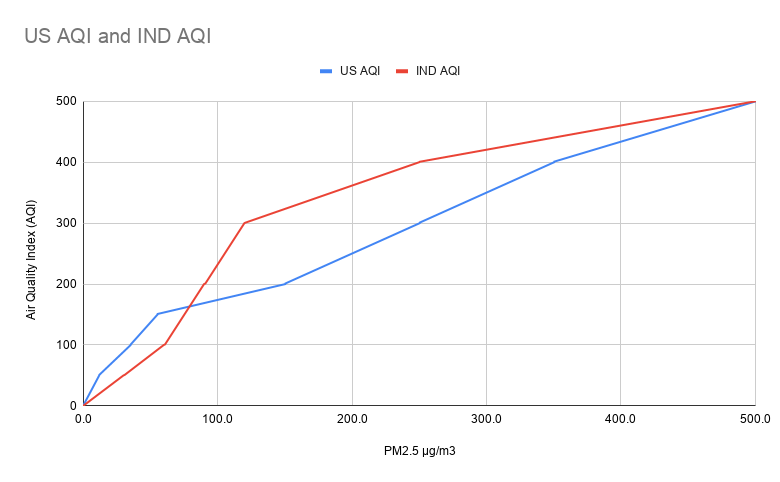
For measuring and interpreting PM2.5, we recommend to use the PM2.5 in μg/m3 instead of the computed AQI.
How to know what the PM2.5 levels are for my location?
You can track PM2.5 using various sources:
- https://aircare.mapshalli.org : High density network for Whitefield, Bangalore
- https://aqi.in for most locations in India.
- https://app.cpcbccr.com/ccr/#/caaqm-dashboard-all/caaqm-landing – Government Central Control Room for Air Quality Management – All India
Resoures
- https://en.wikipedia.org/wiki/Air_quality_index#United_States
- https://en.wikipedia.org/wiki/Air_quality_index#India
- http://www.euro.who.int/__data/assets/pdf_file/0006/189051/Health-effects-of-particulate-matter-final-Eng.pdf
- http://berkeleyearth.org/air-pollution-and-cigarette-equivalence/
- https://aqli.epic.uchicago.edu/the-index/
- https://pubs.acs.org/doi/abs/10.1021/acs.est.5b01236
- https://www.kidney.org/newsletter/environmental-pollution-and-kidney-disease